The 80/20 of PostgreSQL Performance
Most PostgreSQL performance problems come down to three things: missing indexes, bad queries, and insufficient connection management. Before diving into exotic tuning parameters, audit these three areas first. In my experience, 80% of performance issues are solved by proper indexing and query rewriting alone.
Indexing Strategies That Matter
The default B-tree index handles most cases, but knowing when to use specialized indexes is a superpower.
Composite Indexes
Column order matters enormously. A composite index on (status, created_at) is completely different from (created_at, status). The rule of thumb: put your equality conditions first and range conditions last. If you frequently query WHERE status = ‘active’ AND created_at > ‘2024-01-01’, the index should be (status, created_at) — not the reverse.
Partial Indexes
One of PostgreSQL’s most underused features. If 90% of your queries filter for active records, create a partial index: CREATE INDEX idx_active_orders ON orders(created_at) WHERE status = ‘active’. This index is smaller, faster to update, and faster to scan.
GIN Indexes for JSONB
If you’re querying JSONB columns, GIN indexes are non-negotiable. The default operator class (jsonb_ops) supports all operators but is larger. If you only need containment checks, jsonb_path_ops is 2-3x smaller and faster for those specific operations.
Covering Indexes (INCLUDE)
PostgreSQL 11 introduced covering indexes. If your query only needs data that’s in the index plus one or two extra columns, you can INCLUDE them in the index to avoid table lookups entirely. This turns index scans into index-only scans — a significant performance win for read-heavy workloads.
Query Optimization Patterns
EXPLAIN ANALYZE Is Your Best Friend
Never guess at query performance. EXPLAIN ANALYZE shows you exactly what PostgreSQL is doing: which indexes it’s using, how many rows it’s scanning, where time is spent. The key metrics to watch are actual time (not just cost estimates), rows returned versus rows scanned, and whether you’re getting sequential scans on large tables.
Common red flags in execution plans: sequential scans on tables over 10K rows, nested loops on large result sets, hash joins that spill to disk, and sort operations without supporting indexes.
Batch Operations
Updating or deleting millions of rows in a single transaction locks the table and bloats WAL. Instead, process in batches. A simple loop that processes 1000-5000 rows per transaction, with a brief pause between batches, is dramatically better for production systems.
This approach keeps lock contention low, allows autovacuum to work between batches, and won’t cause replication lag on replicas.
CTEs vs Subqueries
PostgreSQL 12+ can inline CTEs (Common Table Expressions) as optimization fences were removed. But be aware: if your CTE is referenced multiple times, PostgreSQL may still materialize it. For single-use CTEs, the optimizer now treats them identically to subqueries. For performance-critical queries, check the execution plan either way.
Connection Management
The Connection Pool Tax
Every PostgreSQL connection consumes about 10MB of memory. With 200 connections, that’s 2GB just for connections — before any query work. On a server with 16GB RAM, that’s a significant chunk of your shared_buffers budget.
PgBouncer Configuration
PgBouncer in transaction mode is the gold standard for connection pooling. It multiplexes many application connections onto fewer database connections. Key settings: pool_size should match your CPU cores (not your application connection count), reserve_pool_size handles traffic spikes, and server_idle_timeout should be tuned to your workload pattern.
A common architecture: your application maintains a pool of 20-50 connections to PgBouncer, which maintains 10-20 connections to PostgreSQL. This gives you the concurrency your app needs without overwhelming the database.
Prepared Statements Caveat
If you use PgBouncer in transaction mode, prepared statements won’t work as expected because statements are bound to a server connection that may change between transactions. Use the extended query protocol or switch to statement-level pooling for workloads that rely heavily on prepared statements.
Configuration Tuning
shared_buffers
Start at 25% of total RAM and rarely go above 40%. PostgreSQL also relies on the OS page cache, so giving it too much memory actually hurts. On a 64GB server, 16GB for shared_buffers is a good starting point.
effective_cache_size
This tells the query planner how much memory is available for caching (shared_buffers plus OS cache). Set it to about 75% of total RAM. It doesn’t allocate memory — it just influences planning decisions. Getting this wrong leads to poor query plans.
work_mem
Controls memory for sort operations and hash joins per operation (not per connection). The default 4MB is conservative. For analytics workloads, 64-256MB is common. Be careful with high values on OLTP systems with many concurrent queries — 100 connections each running a sort at 256MB work_mem could exhaust your memory.
maintenance_work_mem
Used for VACUUM, CREATE INDEX, and ALTER TABLE operations. Set this higher than work_mem — 512MB to 1GB is common. It only applies to maintenance operations, so the concurrency risk is lower.
Monitoring and Maintenance
pg_stat_statements
Install this extension immediately. It tracks query execution statistics and is the single most valuable tool for identifying slow queries. Sort by total_time to find your biggest bottlenecks — a query that takes 5ms but runs 10 million times per day is a bigger problem than one that takes 5 seconds but runs once an hour.
Autovacuum Tuning
The default autovacuum settings are conservative. For high-write tables, you may need to increase autovacuum_vacuum_scale_factor (or decrease it for large tables) and increase autovacuum_vacuum_cost_limit to let vacuum work faster. A table with 100 million rows and the default scale factor of 0.2 won’t vacuum until 20 million dead tuples accumulate — that’s a lot of bloat.
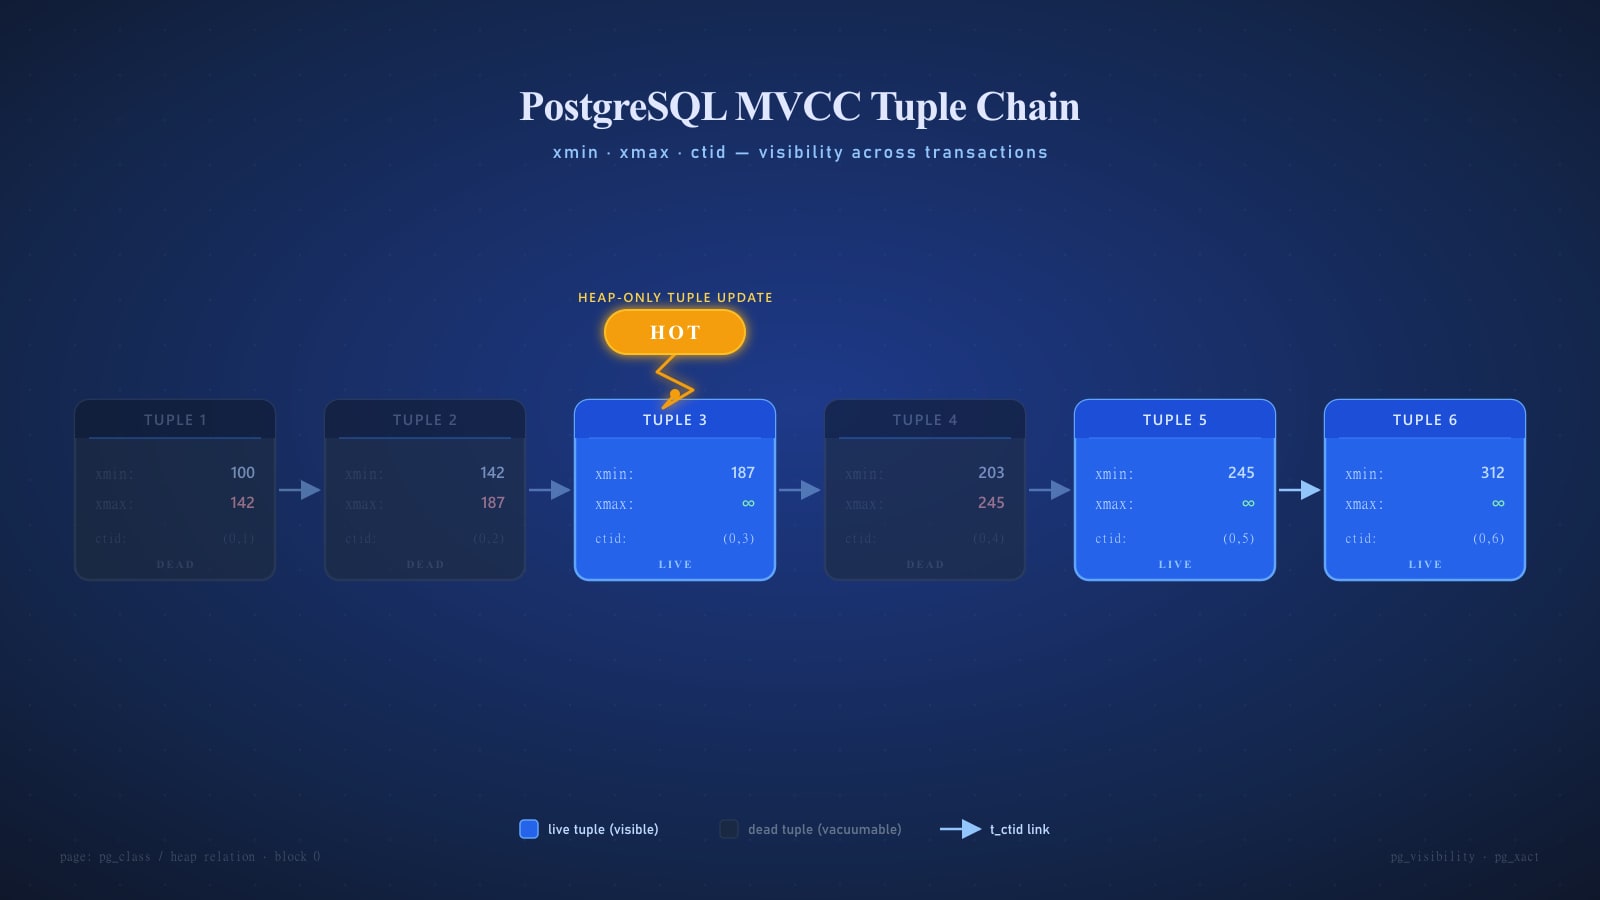
Table Bloat
PostgreSQL’s MVCC means dead tuples accumulate between vacuums. Monitor table bloat with the pgstattuple extension. If a table is more than 30% bloated, consider a manual VACUUM FULL (which locks the table) or use pg_repack for online table rebuilds.
Final Thoughts
PostgreSQL performance tuning is iterative. Start with the fundamentals — proper indexes, optimized queries, connection pooling — and only dive into configuration tuning when you’ve exhausted those options. Monitor everything with pg_stat_statements and set up alerts for slow queries, connection count, and cache hit ratios (aim for 99%+ on your buffer cache hit ratio).
The best optimization is often the query you don’t run at all. Caching, materialized views, and read replicas can eliminate load at the application level before it ever reaches your primary database.