80/20 ของ PostgreSQL Performance
ปัญหาประสิทธิภาพ PostgreSQL ส่วนใหญ่มาจากสามสิ่งง: ดัชนีหายไป, queries ไม่ดี, และการจัดการการเชื่อมต่อที่ไม่เพียงพอ ก่อนจะลงสำหรับ exotic tuning parameters, audit สามสิ่งนี้เป็นอันดับแรก ในประสบการณ์ของฉัน, 80% ของปัญหาประสิทธิภาพจะแก้ไขได้จาก proper indexing และ query rewriting คนเดียว
Indexing Strategies ที่มีความสำคัญ
Default B-tree index จัดการกรณีส่วนใหญ่, แต่รู้เมื่อใช้ specialized indexes คือ superpower
Composite Indexes
Column order มีความสำคัญอย่างมาก Composite index บน (status, created_at) มีความแตกต่างจาก (created_at, status) ไม่เลย Rule of thumb: ใส่ equality conditions ของคุณก่อนและ range conditions สุดท้าย ถ้าคุณบ่อยครั้ง query WHERE status = ‘active’ AND created_at > ‘2024-01-01’, index ควรเป็น (status, created_at) — ไม่ใช่ reverse
Partial Indexes
หนึ่งในฟีเจอร์ที่ underused มากที่สุดของ PostgreSQL ถ้า 90% ของ queries ของคุณกรอง records active, สร้าง partial index: CREATE INDEX idx_active_orders ON orders(created_at) WHERE status = ‘active’ Index นี้มีขนาดเล็กลง, อัปเดตเร็วกว่า, และสแกนเร็วกว่า
GIN Indexes สำหรับ JSONB
ถ้าคุณ querying JSONB columns, GIN indexes คือ non-negotiable Default operator class (jsonb_ops) สนับสนุน operators ทั้งหมด แต่ใหญ่ขึ้น ถ้าคุณต้องการ containment checks เพียงเท่านั้น, jsonb_path_ops มีขนาดเล็ก 2-3x และเร็วกว่าสำหรับการดำเนินการ specific เหล่านั้น
Covering Indexes (INCLUDE)
PostgreSQL 11 นำ covering indexes มา ถ้า query ของคุณต้องการข้อมูลที่อยู่ใน index บวก 1 หรือ 2 คอลัมน์เพิ่มเติม, คุณสามารถ INCLUDE พวกเขาใน index เพื่อหลีกเลี่ยงการค้นหา table ทั้งหมด นี่เปลี่ยน index scans เป็น index-only scans — ชัยชนะประสิทธิภาพที่สำคัญสำหรับ workloads อ่านหนัก
Query Optimization Patterns
EXPLAIN ANALYZE คือ Best Friend ของคุณ
ไม่เคยคาดเดา query performance EXPLAIN ANALYZE แสดงให้คุณเห็นว่า PostgreSQL กำลังทำอะไรอย่างแม่นยำ: indexes ใดที่ใช้ งาน, กี่คนที่สแกน, ที่ใช้เวลา Metrics หลักที่จำ: actual time (ไม่ใช่ cost estimates เพียงอย่างเดียว), rows returned เทียบกับ rows scanned, และคุณได้รับ sequential scans บน large tables หรือไม่
Common red flags ใน execution plans: sequential scans บน tables มากกว่า 10K rows, nested loops บน large result sets, hash joins ที่ spill ไป disk, และ sort operations โดยไม่มี supporting indexes
Batch Operations
อัปเดต หรือ ลบหลายล้าน rows ใน single transaction locks table และ bloats WAL แทน, process ใน batches A simple loop ที่ processes 1000-5000 rows per transaction, ด้วย brief pause ระหว่าง batches, มี dramatically ดีกว่าสำหรับระบบผลิต
วิธีการนี้เก็บ lock contention ต่ำ, อนุญาต autovacuum ทำงานระหว่าง batches, และจะไม่ทำให้เกิด replication lag บน replicas
CTEs เทียบกับ Subqueries
PostgreSQL 12+ สามารถ inline CTEs (Common Table Expressions) เป็น optimization fences ถูกลบออก แต่เป็นอันเดิมรู้: ถ้า CTE ของคุณถูกอ้างอิง multiple times, PostgreSQL อาจยัง materialize มัน สำหรับ single-use CTEs, optimizer ตอนนี้ทำให้พวกเขาเหมือนกับ subqueries สำหรับ performance-critical queries, ตรวจสอบ execution plan อย่างไรก็ตาม
Connection Management
The Connection Pool Tax
ทุก PostgreSQL connection บริโภค about 10MB ของ memory ด้วย 200 connections, นั่นคือ 2GB เพียงสำหรับการเชื่อมต่อ — ก่อน any query work บน server ด้วย 16GB RAM, นั่นคือ significant chunk ของคุณ shared_buffers budget
PgBouncer Configuration
PgBouncer ใน transaction mode คือ gold standard สำหรับ connection pooling มัน multiplexes many application connections ไป fewer database connections Key settings: pool_size ควรตรง CPU cores ของคุณ (ไม่ใช่ application connection count ของคุณ), reserve_pool_size จัดการ traffic spikes, และ server_idle_timeout ควรปรับแต่งสำหรับ workload pattern ของคุณ
Common architecture: แอปพลิเคชันของคุณรักษา pool ของ 20-50 connections ไป PgBouncer, ซึ่งรักษา 10-20 connections ไป PostgreSQL นี่ให้คุณความพร้อมใจที่แอปพลิเคชันของคุณต้องการโดยไม่ overwhelm database
Prepared Statements Caveat
ถ้าคุณใช้ PgBouncer ใน transaction mode, prepared statements จะไม่ทำงานตามที่คาดไว้เพราะ statements ถูก bound ไป server connection ที่อาจเปลี่ยนระหว่าง transactions ใช้ extended query protocol หรือ switch ไป statement-level pooling สำหรับ workloads ที่ rely heavily บน prepared statements
Configuration Tuning
shared_buffers
เริ่มต้นที่ 25% ของ total RAM และ rarely ไป above 40% PostgreSQL ยังอาศัย OS page cache, ดังนั้น giving มันมาก memory จริงๆ hurt แล้ว บน 64GB server, 16GB สำหรับ shared_buffers คือ good starting point
effective_cache_size
นี่บอก query planner ว่า memory เท่าไรพร้อมใช้สำหรับ caching (shared_buffers บวก OS cache) ตั้ง มัน ไป about 75% ของ total RAM มัน allocate ไม่ memory — มัน เพียง influences planning decisions getting นี้ผิด leads ไป poor query plans
work_mem
Controls memory สำหรับ sort operations และ hash joins per operation (ไม่ใช่ per connection) Default 4MB conservative สำหรับ analytics workloads, 64-256MB common ระวังด้วย high values บน OLTP systems ด้วย many concurrent queries — 100 connections แต่ละเรียกใช้ sort ที่ 256MB work_mem อาจ exhaust memory ของคุณ
maintenance_work_mem
ใช้สำหรับ VACUUM, CREATE INDEX, และ ALTER TABLE operations ตั้ง นี่ สูงกว่า work_mem — 512MB ไป 1GB common มัน apply เพียง ไป maintenance operations, เพื่อ concurrency risk lower
Monitoring และ Maintenance
pg_stat_statements
ติดตั้ง extension นี้ทันที มัน tracks query execution statistics และ single most valuable tool สำหรับ identifying slow queries Sort by total_time ไป find biggest bottlenecks ของคุณ — query ที่ใช้เวลา 5ms แต่เรียก 10 million times per day คือ ปัญหา bigger กว่า one ที่ใช้เวลา 5 seconds แต่เรียก once an hour
Autovacuum Tuning
Default autovacuum settings conservative สำหรับ high-write tables, คุณ อาจต้อง increase autovacuum_vacuum_scale_factor (หรือ decrease สำหรับ large tables) และ increase autovacuum_vacuum_cost_limit ให้ vacuum ทำงาน faster A table ด้วย 100 million rows และ default scale factor ของ 0.2 จะไม่ vacuum จนกว่า 20 million dead tuples accumulate — นั่นคือ lot ของ bloat
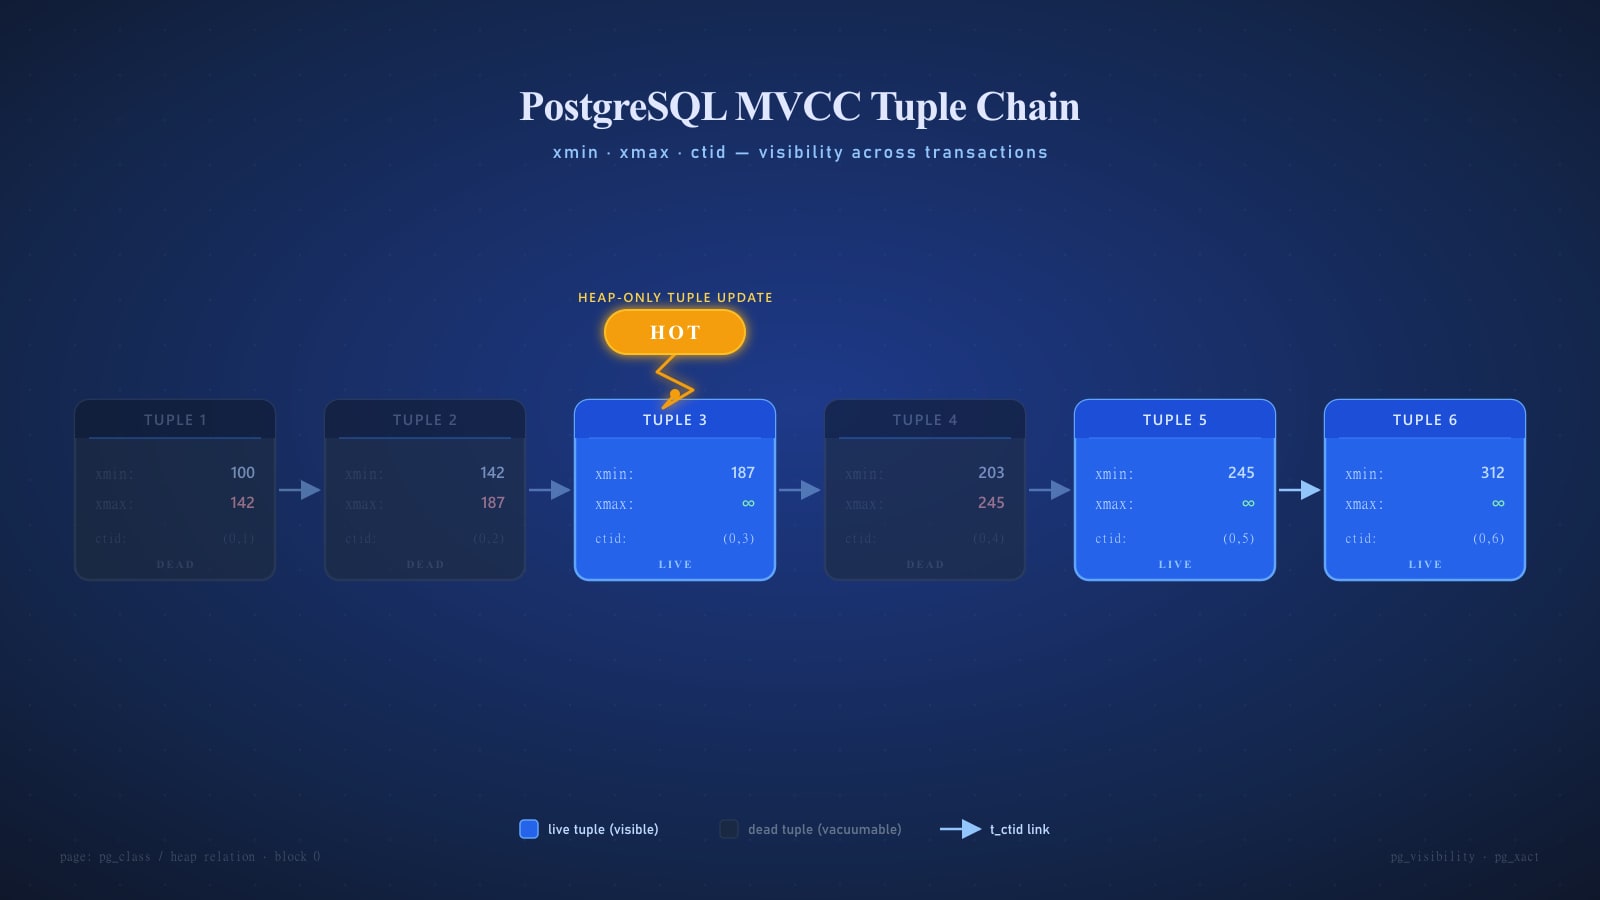
Table Bloat
PostgreSQL’s MVCC หมายถึง dead tuples accumulate ระหว่าง vacuums Monitor table bloat ด้วย pgstattuple extension ถ้า table มี more than 30% bloated, พิจารณา manual VACUUM FULL (ซึ่ง locks table) หรือ ใช้ pg_repack สำหรับ online table rebuilds
Final Thoughts
PostgreSQL performance tuning iterative เริ่มต้นด้วย fundamentals — proper indexes, optimized queries, connection pooling — และ dive เพียง ลงไป configuration tuning เมื่อคุณ exhausted options เหล่านั้น Monitor ทุกอย่าง ด้วย pg_stat_statements และ ตั้ง alerts สำหรับ slow queries, connection count, และ cache hit ratios (aim สำหรับ 99%+ บน buffer cache hit ratio ของคุณ)
Best optimization มักจะ query คุณ ไม่ run เลย Caching, materialized views, และ read replicas สามารถ eliminate load ที่ application level ก่อน มัน ever ถึง primary database ของคุณ