Flowchart Diagrams: A Practical Guide to Every Symbol and When to Use It
A flowchart turns a process — business workflow, algorithm, data pipeline, incident response — into a picture your teammate can read in thirty seconds. Done well, it prevents entire classes of bugs and miscommunication. Done poorly, it misleads readers or, worse, everyone ignores it.
This guide is symbol-first. Every flowchart tool in the world implements roughly the same set of shapes, standardised in ANSI/ISO 5807, and each shape carries a specific meaning. If you know what every symbol means and when to reach for it, you can read any flowchart in the wild and draw one that others can trust.
Why Flowcharts Matter
Three reasons flowcharts pull their weight in engineering and operations work.
Shared understanding. A paragraph describing “the user logs in and we check their role, then if they’re an admin they see dashboard A, otherwise dashboard B” is ambiguous — what happens if role is null? A flowchart forces every branch to have a defined next step. Ambiguity becomes visible.
Review surface. It is much faster to spot a missing error branch in a diagram than in 40 lines of prose. Reviewers look at the diamonds and ask “what happens on the ‘no’ side?” — and the gaps jump out.
Handoff artefact. When a process spans multiple teams (engineering → QA → ops → support), a flowchart with swim-lanes is the one document all four can read. It is not code and not a Jira ticket — it is the contract between roles.
The Standard Symbol Set (ANSI/ISO 5807)
The symbols below are the internationally standardised set. Every flowchart tool — Lucidchart, draw.io, Visio, Mermaid, PlantUML — implements them. Learn these once and you can read any flowchart.
1. Terminator (Start / End)
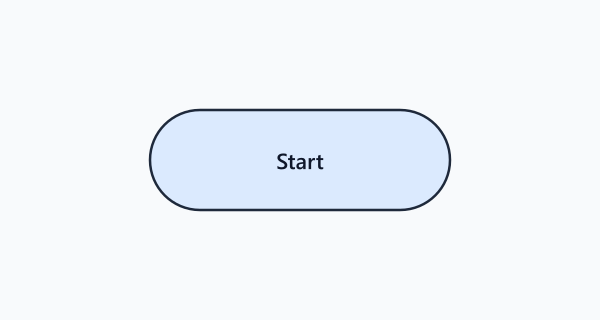
Shape: rounded rectangle (pill) or oval.
Meaning: the beginning or end of a process. Every flowchart has exactly one start terminator and one or more end terminators.
When to use: always — a flowchart without a terminator is incomplete. If your process has multiple possible endings (e.g. success, failure, timeout), draw a separate end terminator for each.
Mermaid:
flowchart TD
  Start([Start]) --> DoWork[Process the request]
  DoWork --> Success([Success])
  DoWork --> Fail([Failure])
2. Process (Action / Task)
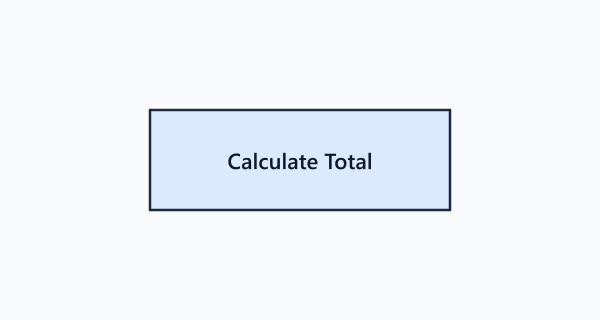
Shape: rectangle.
Meaning: a single unit of work — an action, transformation, or computation. “Validate email”, “Charge the card”, “Send welcome email”.
When to use: any step that does something but does not make a decision and is not I/O. Keep the label verb-first and short — “Charge card”, not “The system charges the user’s card via Stripe”.
Rule of thumb: if you cannot summarise the step in four or five words, it probably should be two or three separate process boxes.
3. Decision
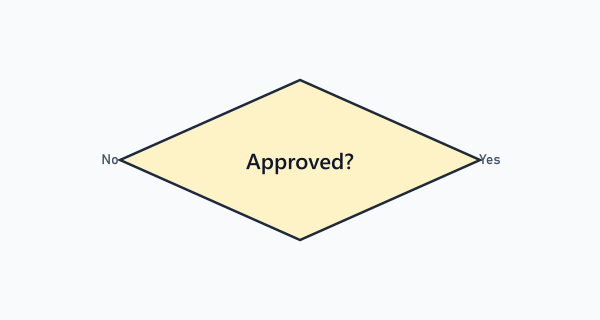
Shape: diamond (rhombus).
Meaning: a branch point with a yes/no or multi-way answer. Exactly one arrow in, two or more out. Each outgoing arrow is labelled with the answer it represents.
When to use: any if, switch, or business rule that changes the flow.
flowchart TD
  A[Check inventory] --> B{In stock?}
  B -->|Yes| C[Create order]
  B -->|No| D[Show backorder page]
Common mistakes:
- Forgetting to label the branches — every outgoing arrow MUST carry the answer (Yes/No/Partial/Error). An unlabelled branch is ambiguous.
- A diamond with one outgoing arrow — that is just a process box; the diamond only earns its shape when the flow splits.
- A diamond with many outgoing arrows — if you have four or five branches, consider splitting into nested decisions or using a Predefined Process step that encapsulates the logic.
4. Input / Output
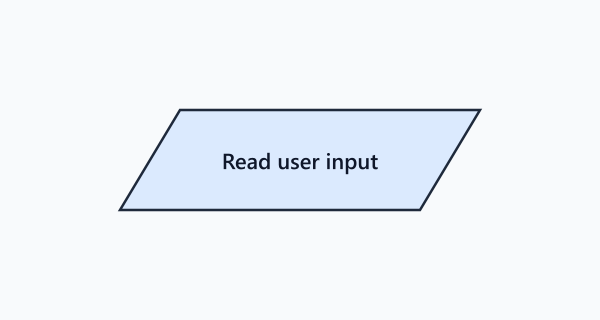
Shape: parallelogram.
Meaning: data entering or leaving the system. User input, file read/write, API request/response, console output.
When to use: any step that crosses a system boundary — not internal computation, but data exchange with a user, file system, network, or another service.
flowchart TD
  U[/User enters credentials/] --> V[Validate credentials]
  V --> R[/Return JWT to client/]
Note: Mermaid’s [/...\] and [\...\/] syntax produces parallelograms. Many teams get lazy and use rectangles everywhere — that loses the “this crosses a boundary” signal.
5. Predefined Process (Subroutine)
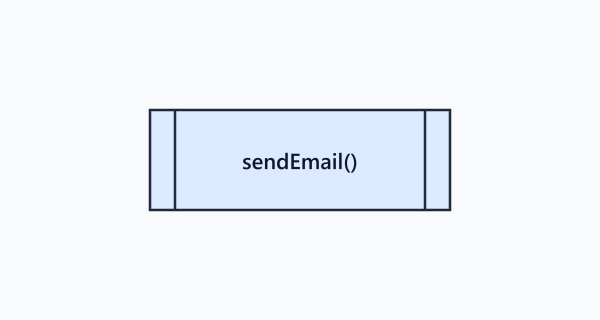
Shape: rectangle with vertical bars on the left and right sides ([[label]] in Mermaid → subroutine).
Meaning: a step that is itself a full process defined elsewhere. Like a function call — you do not expand it here, you point to another flowchart.
When to use: when the process has an inline step that is either reused across multiple flowcharts or is complex enough to warrant its own diagram. Keep the top-level flowchart skimmable and drill down with subroutines.
flowchart TD
  A[Receive order] --> B[[Validate payment]]
  B --> C[[Fulfil order]]
  C --> D([Done])
6. Document
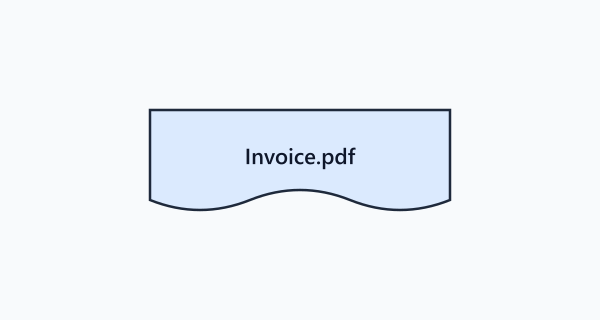
Shape: rectangle with a wavy bottom edge.
Meaning: a document or report generated/consumed by the process — an invoice, PDF, email body, audit log entry.
When to use: whenever a physical or digital document is the output of a step. Do not confuse with generic I/O — use Document when the output’s form matters (a printable report vs. a data payload).
7. Data / Stored Data
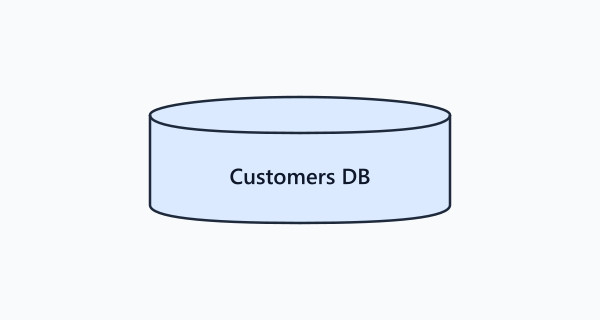
Shape: cylinder.
Meaning: a database, file store, or persistent data store that a step reads from or writes to.
When to use: when a step interacts with persistent state. Label the cylinder with the store’s name (“users table”, “S3 bucket”, “Redis cache”).
flowchart TD
  A[Register user] --> B[(users)]
  A --> C[(audit_log)]
  A --> D([Done])
8. Manual Operation
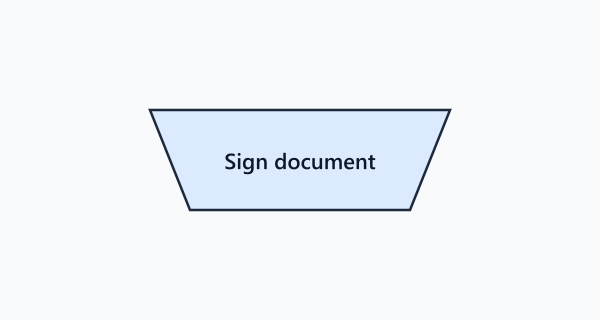
Shape: trapezoid (inverted trapezoid in some notations).
Meaning: a step performed by a human, not by automation. “Analyst reviews flagged transaction”, “Support agent calls customer”.
When to use: in business process flowcharts that mix automated and manual steps. Being explicit that a step is human-driven helps reviewers spot the slowest links in the process.
9. Manual Input
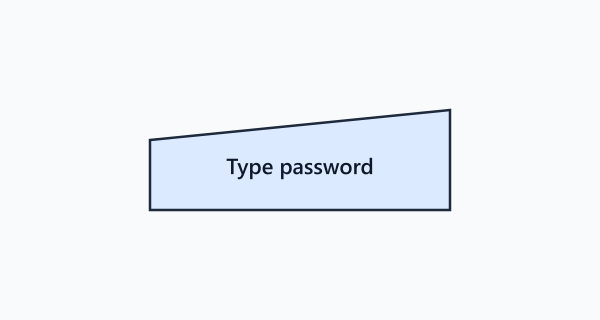
Shape: rectangle with a slanted top (like a keyboard).
Meaning: data entered by a human via keyboard, form, or voice — specifically distinguishing human-entered data from machine-generated I/O.
When to use: when a flowchart needs to separate “user typed this” from “system pulled this from a DB”. Useful in UX flows and customer-journey diagrams.
10. Display
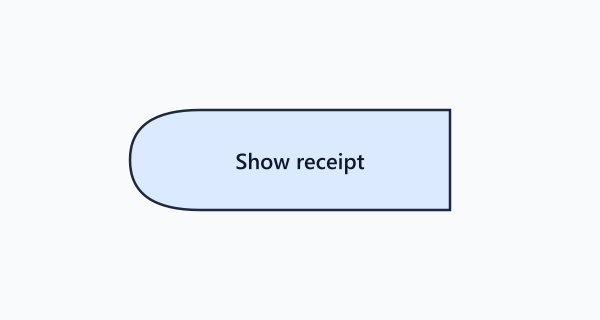
Shape: rectangle with a curved left side (like a CRT screen).
Meaning: information shown to a user on a screen.
When to use: to mark the moment a user sees something — a confirmation page, an error message, a dashboard update.
11. Preparation
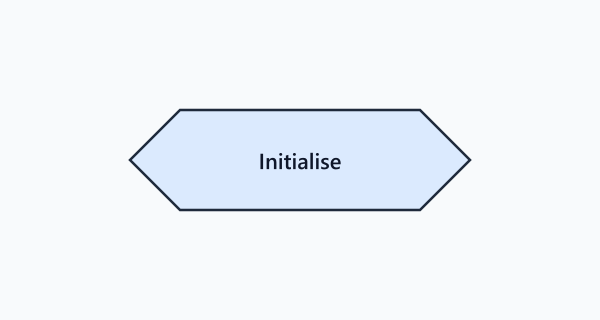
Shape: hexagon.
Meaning: a setup step before a loop, or initialization of resources.
When to use: at the start of a loop to indicate counter initialization, or before a block of steps that need resources prepared (session open, connection established, cache warmed).
12. Delay
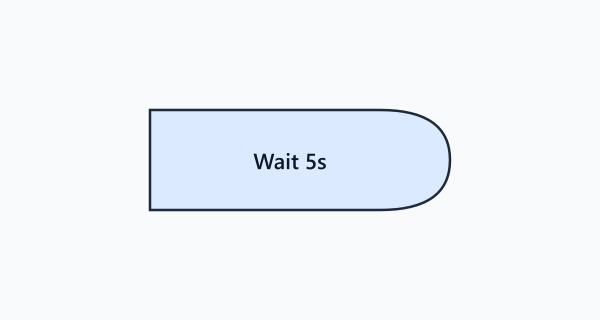
Shape: half-rounded rectangle (capsule).
Meaning: a timed wait — “wait 24 hours”, “sleep 5 minutes”, “retry after backoff”.
When to use: any step where time itself is the action. Useful in retry logic, scheduled jobs, and SLA flows.
13. Merge
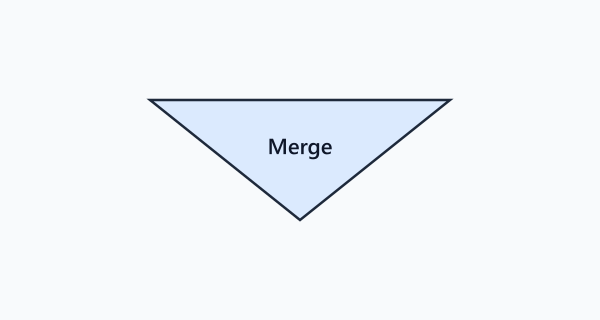
Shape: downward-pointing triangle.
Meaning: two or more branches converge back into a single flow.
When to use: after a decision, once both branches have handled their cases and flow continues from a common point. In Mermaid, the join is implicit (multiple arrows pointing at the same node), but in Visio/draw.io you draw a merge symbol.
14. Connector (On-Page)
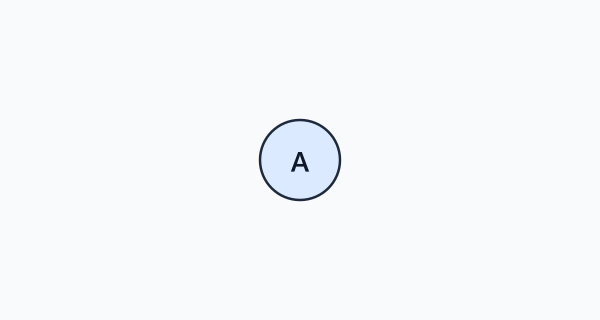
Shape: small circle.
Meaning: a label used to break a long arrow. The arrow exits into a circle labelled A, and another circle labelled A appears elsewhere on the same page where the flow continues.
When to use: when a flowchart is too tangled to route an arrow cleanly. Use sparingly — a diagram that relies on many connectors is telling you to split it into multiple diagrams.
15. Off-Page Connector
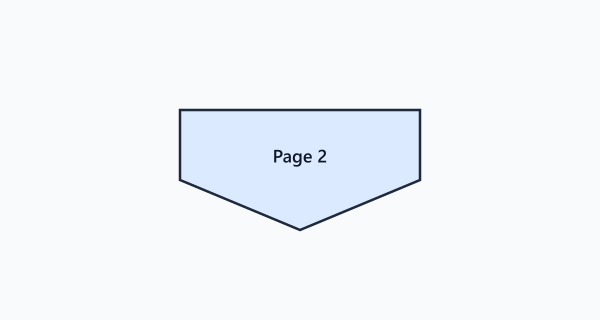
Shape: home-plate pentagon (square with a triangle point).
Meaning: the flow continues on another page or another diagram.
When to use: when a process is too big for a single page — it is better to split across pages with labelled off-page connectors than to shrink everything to 6pt font.
16. Flow Line (Arrow)
Shape: a line with an arrowhead.
Meaning: the direction of flow between two shapes. Always draws from source to destination.
Rules:
- Always unidirectional — no double-headed arrows.
- Minimise crossings; when they must cross, use a small bridge hop to indicate the line is not connected.
- Default reading direction is top-to-bottom, then left-to-right.
Reading and Drawing Direction
Western readers scan top-to-bottom, left-to-right, so the default flowchart direction is TD (top-down) or LR (left-to-right). Mermaid makes this explicit:
flowchart LR
A[Input] --> B[Transform] --> C[Output]- TD / TB (top-down / top-to-bottom): preferred for long vertical processes (e.g. a CI/CD pipeline)
- LR (left-to-right): preferred for short wide flows (e.g. a data transformation chain)
- BT / RL: rare — only use when you have a strong reason (e.g. stack depth visualisation)
Flowchart Types by Purpose
Not every flowchart is the same shape. Match the type to the question you’re answering.
| Type | What it shows | Best for |
|---|---|---|
| Process Flowchart | Steps in a procedure | Documenting how something works |
| Swimlane Flowchart | Steps + who (or what system) performs each | Cross-team workflows, handoffs |
| Data Flow Diagram (DFD) | Where data moves + who transforms it | Data pipelines, ETL jobs |
| System Flowchart | Components and their interactions | High-level architecture |
| Program Flowchart | Logic of a single algorithm | Code-level design, interviews |
| Decision Tree | Nested decisions, one outcome per leaf | Classification rules, routing |
Swimlane Flowchart
A swimlane diagram adds one new idea to the basic flowchart: horizontal (or vertical) lanes, each owned by one actor (a person, team, or system). Every step sits in the lane of whoever performs it, so the handoffs between actors are visible at a glance.
flowchart TB
  subgraph Customer
    A1[Submit order]
  end
  subgraph Payment
    B1[Charge card]
    B2{Success?}
  end
  subgraph Fulfilment
    C1[Pack shipment]
    C2[Send tracking email]
  end
  A1 --> B1 --> B2
  B2 -->|Yes| C1 --> C2
  B2 -->|No| A2[Show error to customer]
Rule: each swimlane corresponds to exactly one actor. If you cannot decide whether a step belongs to Team A or Team B, that is the smell — clarify ownership, then draw.
Data Flow Diagram (DFD)
A DFD is a flowchart variant that focuses on data rather than control. Its symbols differ slightly:
- External entity (square): who sends or receives the data (user, third-party API)
- Process (circle or rounded rectangle): a step that transforms the data
- Data store (open-ended rectangle): where data rests
- Data flow (arrow): a named flow of data
DFDs are drawn at multiple levels of detail:
- Level 0 (Context diagram): one process in the middle, external entities around it. One-page summary.
- Level 1: the single level-0 process decomposed into 3–7 sub-processes.
- Level 2+: decompose each level-1 process further as needed.
A Complete Example: Password Reset Flow
Putting it all together with a real process.
flowchart TD
  Start([User clicks 'Forgot password']) --> InputEmail[/User enters email/]
  InputEmail --> Lookup[Look up user by email]
  Lookup --> DB1[(users)]
  Lookup --> Exists{User exists?}
  Exists -->|No| ShowOK[/Show 'check your email' to prevent enumeration/]
  Exists -->|Yes| GenToken[Generate reset token]
  GenToken --> Store[Store token with 1h expiry]
  Store --> DB2[(password_resets)]
  Store --> SendEmail[[Send reset email]]
  SendEmail --> ShowOK
  ShowOK --> End1([End — user sees neutral confirmation])

  UserClick([User clicks reset link]) --> GetToken[/Read token from URL/]
  GetToken --> Validate{Valid & not expired?}
  Validate -->|No| ShowFail[/Show 'link invalid or expired'/]
  ShowFail --> End2([End — user retries])
  Validate -->|Yes| NewPwd[/User sets new password/]
  NewPwd --> UpdatePwd[Hash & update password]
  UpdatePwd --> DB3[(users)]
  UpdatePwd --> Invalidate[Invalidate all existing sessions]
  Invalidate --> DB4[(sessions)]
  Invalidate --> End3([End — user logged in])
This single diagram carries all the important details that would take a page of prose to describe:
- Security property (enumerate protection) — visible in the “Yes”/“No” paths both leading to the same neutral confirmation
- Persistence layer — three separate tables are referenced
- Session invalidation — a step that is often missed in hand-written specs
Flowchart Tools — What to Use
Diagrams-as-code
- Mermaid (mermaid.js.org). My default. Text lives next to code, renders natively in GitHub, GitLab, Notion, and most Markdown processors. Supports most flowchart types + sequence, state, ER, Gantt. Caveats: layout engine is limited; for dense diagrams, Mermaid’s auto-layout can place arrows awkwardly.
- PlantUML. Wider shape vocabulary, better layout for activity diagrams and sequence diagrams. Requires a render server. Syntax is less intuitive than Mermaid.
- D2 (d2lang.com). Newer, aesthetic defaults, nice sticky containers. Still maturing.
Drag-and-drop
- draw.io / diagrams.net. Free, works offline, saves
.drawioXML that’s diff-friendly enough. My go-to for bigger swim-lanes where auto-layout bites. - Lucidchart. Polished commercial tool, strong templates. Worth it if your organisation already uses it.
- Excalidraw. Sketchy hand-drawn aesthetic. Great for whiteboard-style design sessions; weaker for “final” documentation.
Whiteboard
For architecture discussions, nothing beats a whiteboard. But photograph the whiteboard at the end of the session, then re-draw in a tool within 24 hours — photos age badly and get lost.
Best Practices
Start with the end. Before you draw a box, decide what the reader should take away. A process flowchart answers “how do I do X?” — a DFD answers “where does the data live?” — a swim-lane answers “who does what, when?”. Match the form to the answer.
One page, one idea. If the flowchart doesn’t fit comfortably on a single screen at readable size, split it. Use predefined process symbols to point at the subdiagrams.
Label every branch. Every arrow out of a diamond carries the condition that takes you down that branch. Every arrow into a merge is implicit — it just means “also arrives here”.
Symbols over colour. Use the correct shape for each step, and let colour carry secondary meaning (team ownership, SLA priority, etc.) — not primary meaning. A colourblind reader should still be able to follow the flow.
Left-to-right reads like a sentence. A good flowchart has a clear main axis. Detours (error paths, async branches) should visually leave the axis, do their work, and either return or terminate. Avoid diagrams where the “happy path” zig-zags.
Reviewers > tools. The best flowchart is the one two people have argued about. If nobody has reviewed it, assume it is wrong somewhere. Paste it into the PR or the design doc and ask for explicit feedback.
Common Mistakes
Six patterns that show up again and again in flowcharts that confuse readers.
-
Rectangles for everything. Using the rectangle as a universal shape robs the diagram of its structural information. Decisions should be diamonds; I/O should be parallelograms; data stores should be cylinders.
-
Unlabelled branches. A diamond with a Yes arrow and an unlabelled arrow leaves the reader guessing whether the missing label is “No” or “No / Error” or “Default”. Always label both (or all) branches.
-
Implicit happy path. Drawing the happy path in detail but collapsing error branches into “something goes wrong → end” hides the complexity where bugs live. Draw error paths with the same care as success paths.
-
No terminators. A flowchart that fades off the page is incomplete. Every path should lead to an explicit end terminator.
-
Too much detail on one diagram. A good rule of thumb is 7 ± 2 shapes per level of abstraction. Above that, split into sub-diagrams using predefined-process steps.
-
Outdated diagrams. The only thing worse than no diagram is a diagram that describes the system as it was six months ago. Either commit to keeping the diagram current (ideally as-code next to the source) or don’t draw it at all — stale diagrams actively mislead.
Wrapping Up
Flowcharts are not about being an artist. They are about making a process so clear that nobody has to ask “what happens next?”. The symbol set is small — sixteen shapes cover 99% of what you’ll ever need to draw. The typography is simple. The discipline is all about choosing the right shape for the right meaning and labelling every branch.
Next time you start to explain a process in Slack or a design doc, try drawing it first. You’ll find that the act of picking the right shape for each step clarifies your own thinking — and by the time you’re finished, half your audience’s questions are already answered on the page.